Comparative Analysis of Chaos Scenarios
Chaos Scenario Dashboard allows you to manage your chaos scenario runs, schedules & statistics.
Long-term Statistics
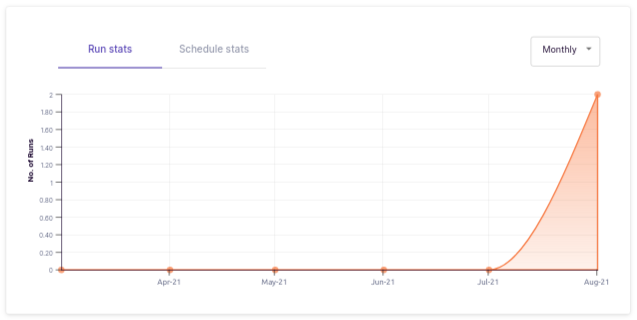
Long-term Statistics provides details about chaos scenario runs & schedules over time.
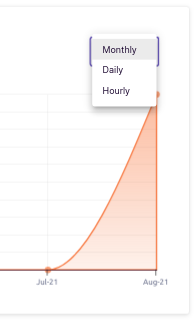
In first tab, you can compare number of chaos scenario runs according to selected granuality i.e. Daily/Monthly/Hourly. Granuality can be changed using drop-down in top right corner.
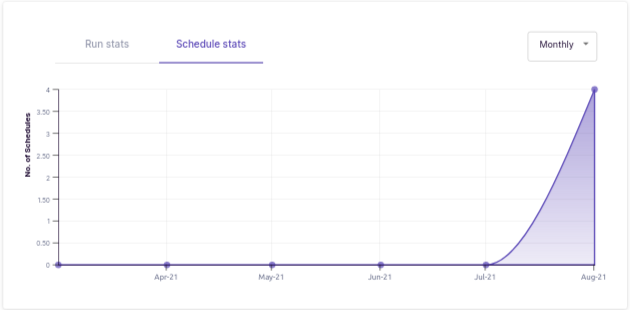
Similarily, In other tab, you can also compare schedules according to selected granuality.

info
You can hover over the respective graphs to get the total chaos scenario runs & total schedules respectively.
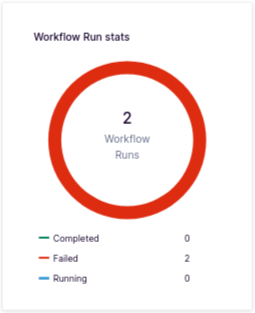
Total Chaos Scenario Statistics
Total Chaos Scenario Statistics helps you to see how many of their scheduled have been passing/ failing & running. This helps you to see average performance of all the chaos scenario runs.
Comparing Multiple Scenarios
List of chaos scenarios provided on the page helps you to keep track of their scheduled chaos scenarios along with associated details like chaos scenario name, chaos delegate, starting time,etc & allows to compare the chaos scenarios by selecting them from the table.
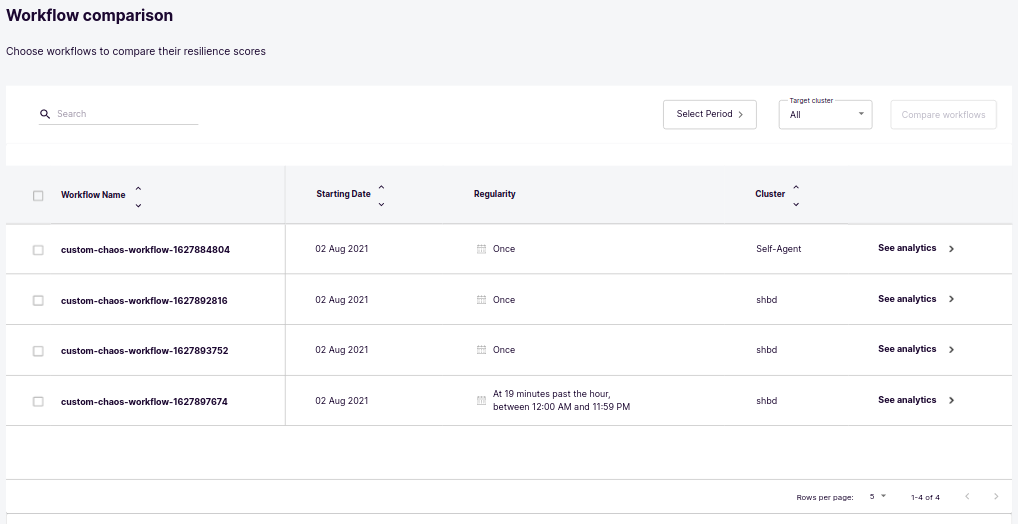
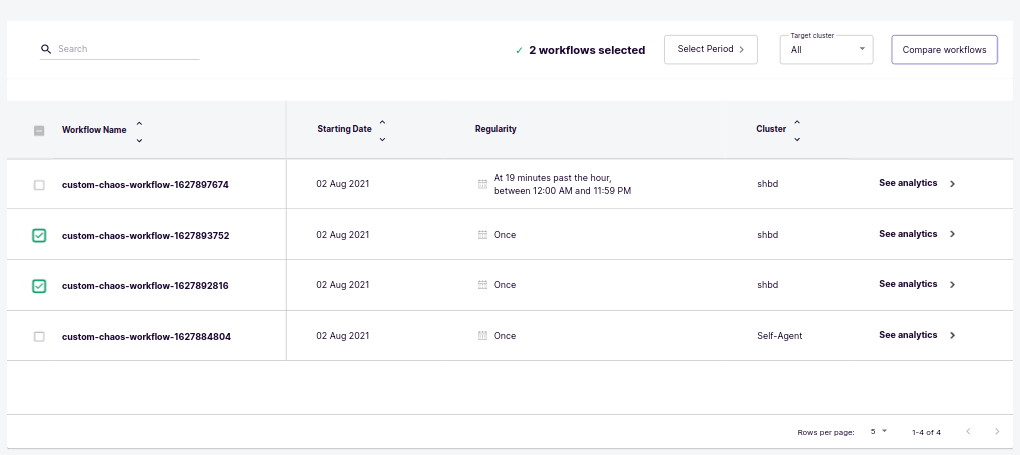
For comparing the chaos scenarios, you can select the scenarios from the table & click on Compare Chaos Scenario button.
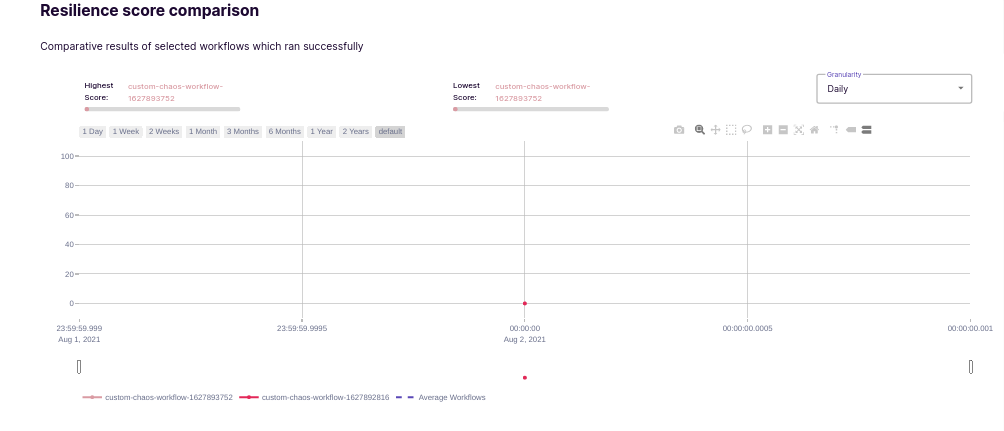
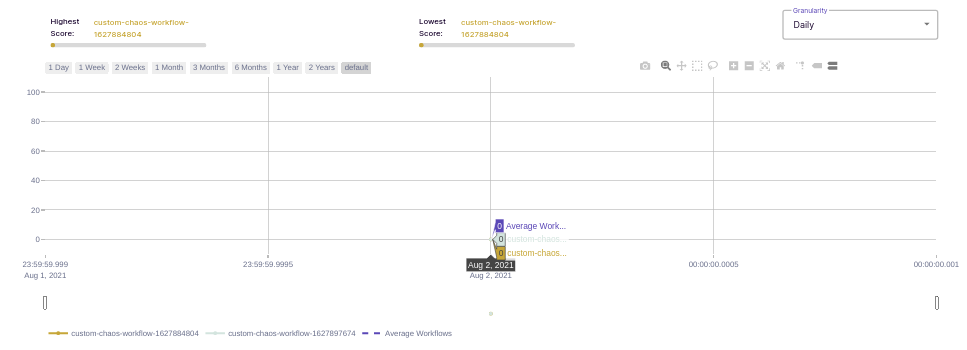
Once, user clicks on Compare Chaos Scenario button, they will be presented with a graph, which shows comparison of selected chaos scenarios with respect to resilience score.
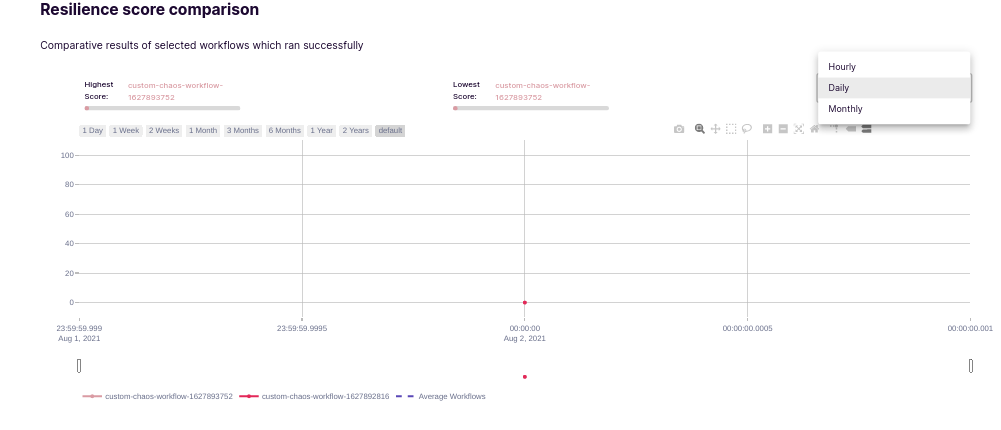
You can change the granuality by clicking on drop-down in top right corner. We can choose between Hourly/ Daily/ Monthly.
note
By hovering over the dots on comparison graph, you can see the resiliency score of compared chaos scenarios & also average chaos scenarios.
The Comparison report can be downloaded in PDF form using the export button given in header of table.

Sample chaos scenario comparison report can be downloaded from here